|
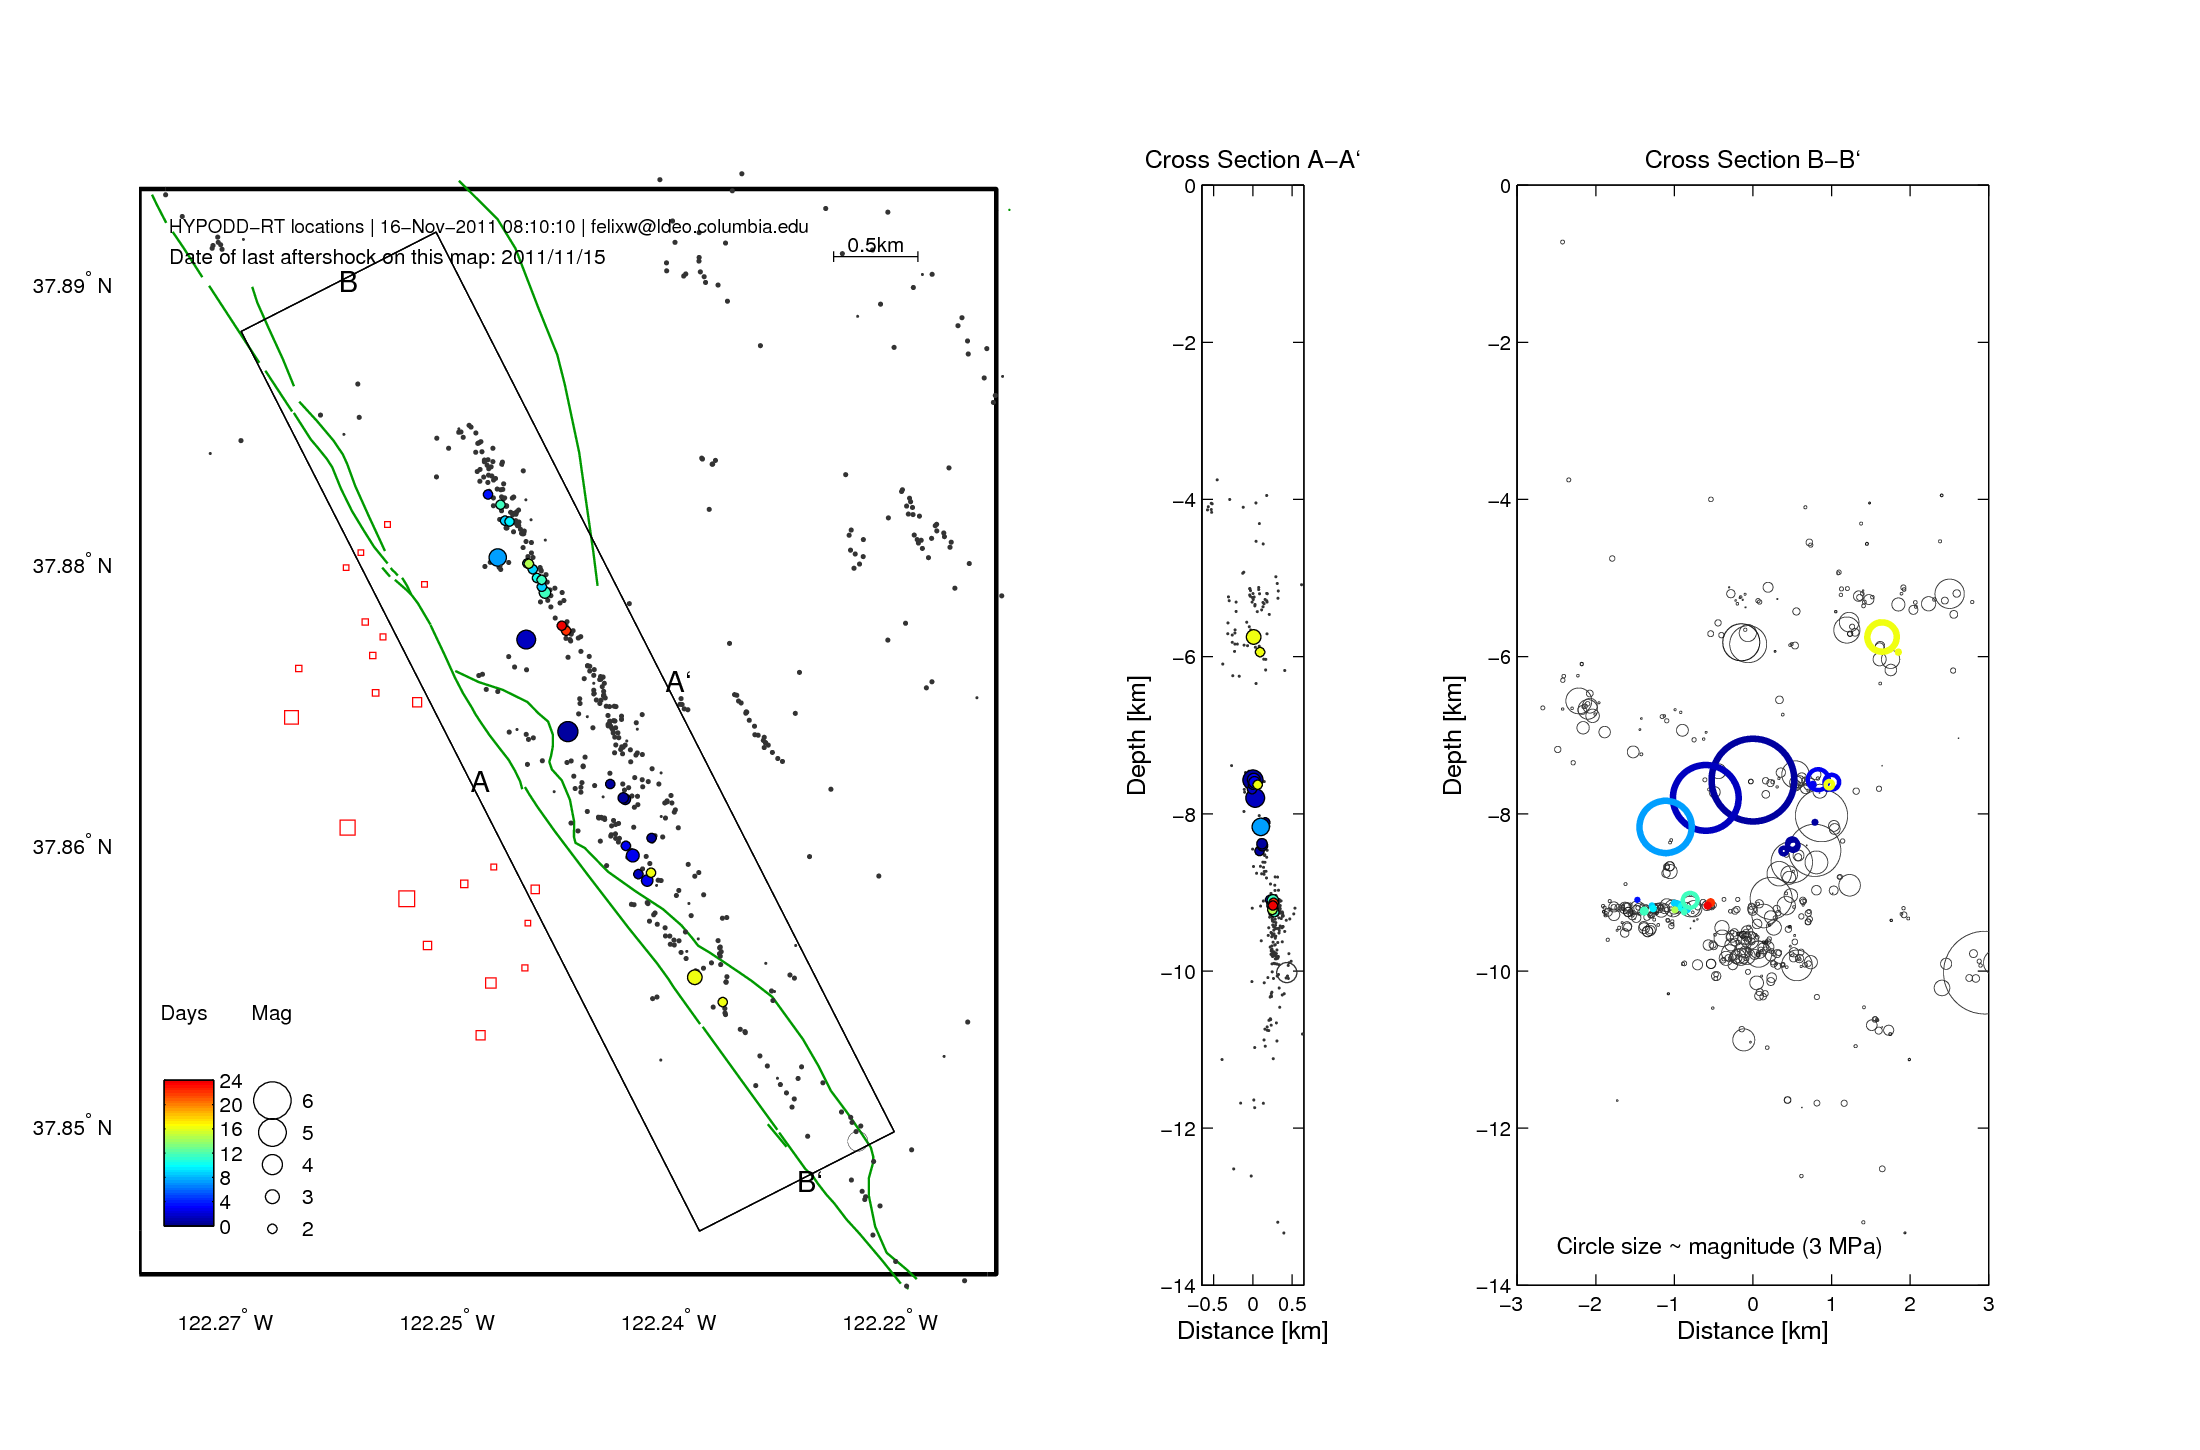
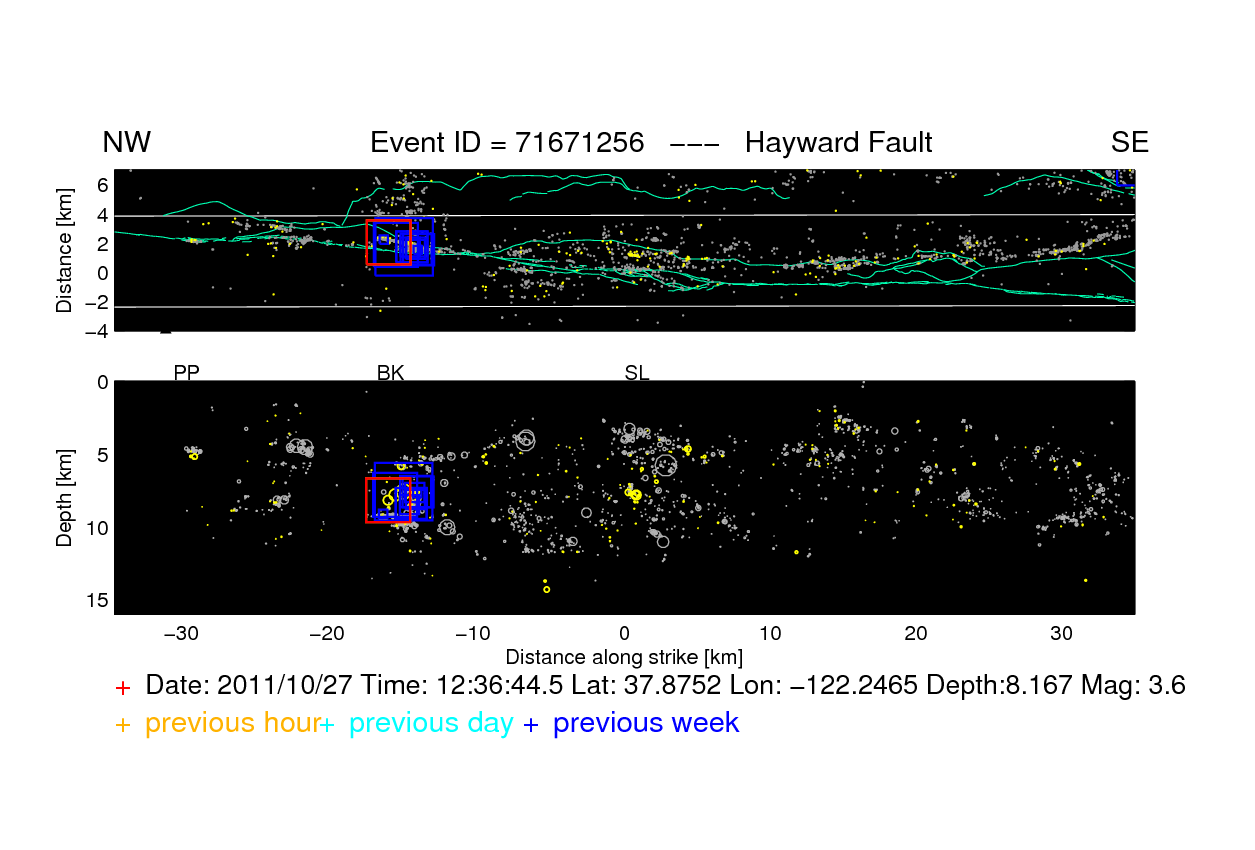
Map view, fault perpendicular, and fault longitudinal cross sections of real-time double-difference locations of the mainshock and its aftershocks (colored dots and circles). Gray dots and circles represent high-res background seismicity. Circle size in B-B` is proportional to magntiude for 3 MPa stress drop source. Squares in map view show routine network locations for comparison. Green lines in map view are fault traces. Click on figure to zoom in. |
3D view of sequence.
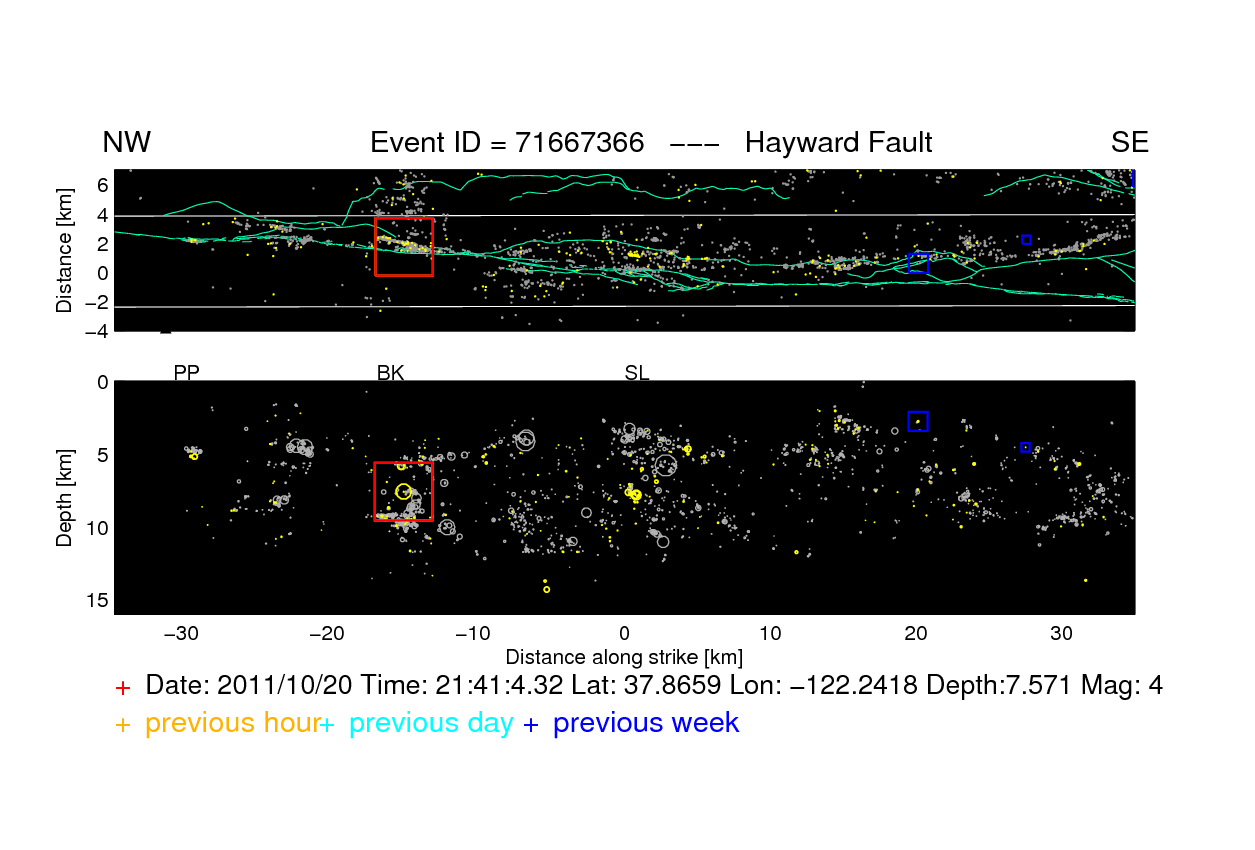
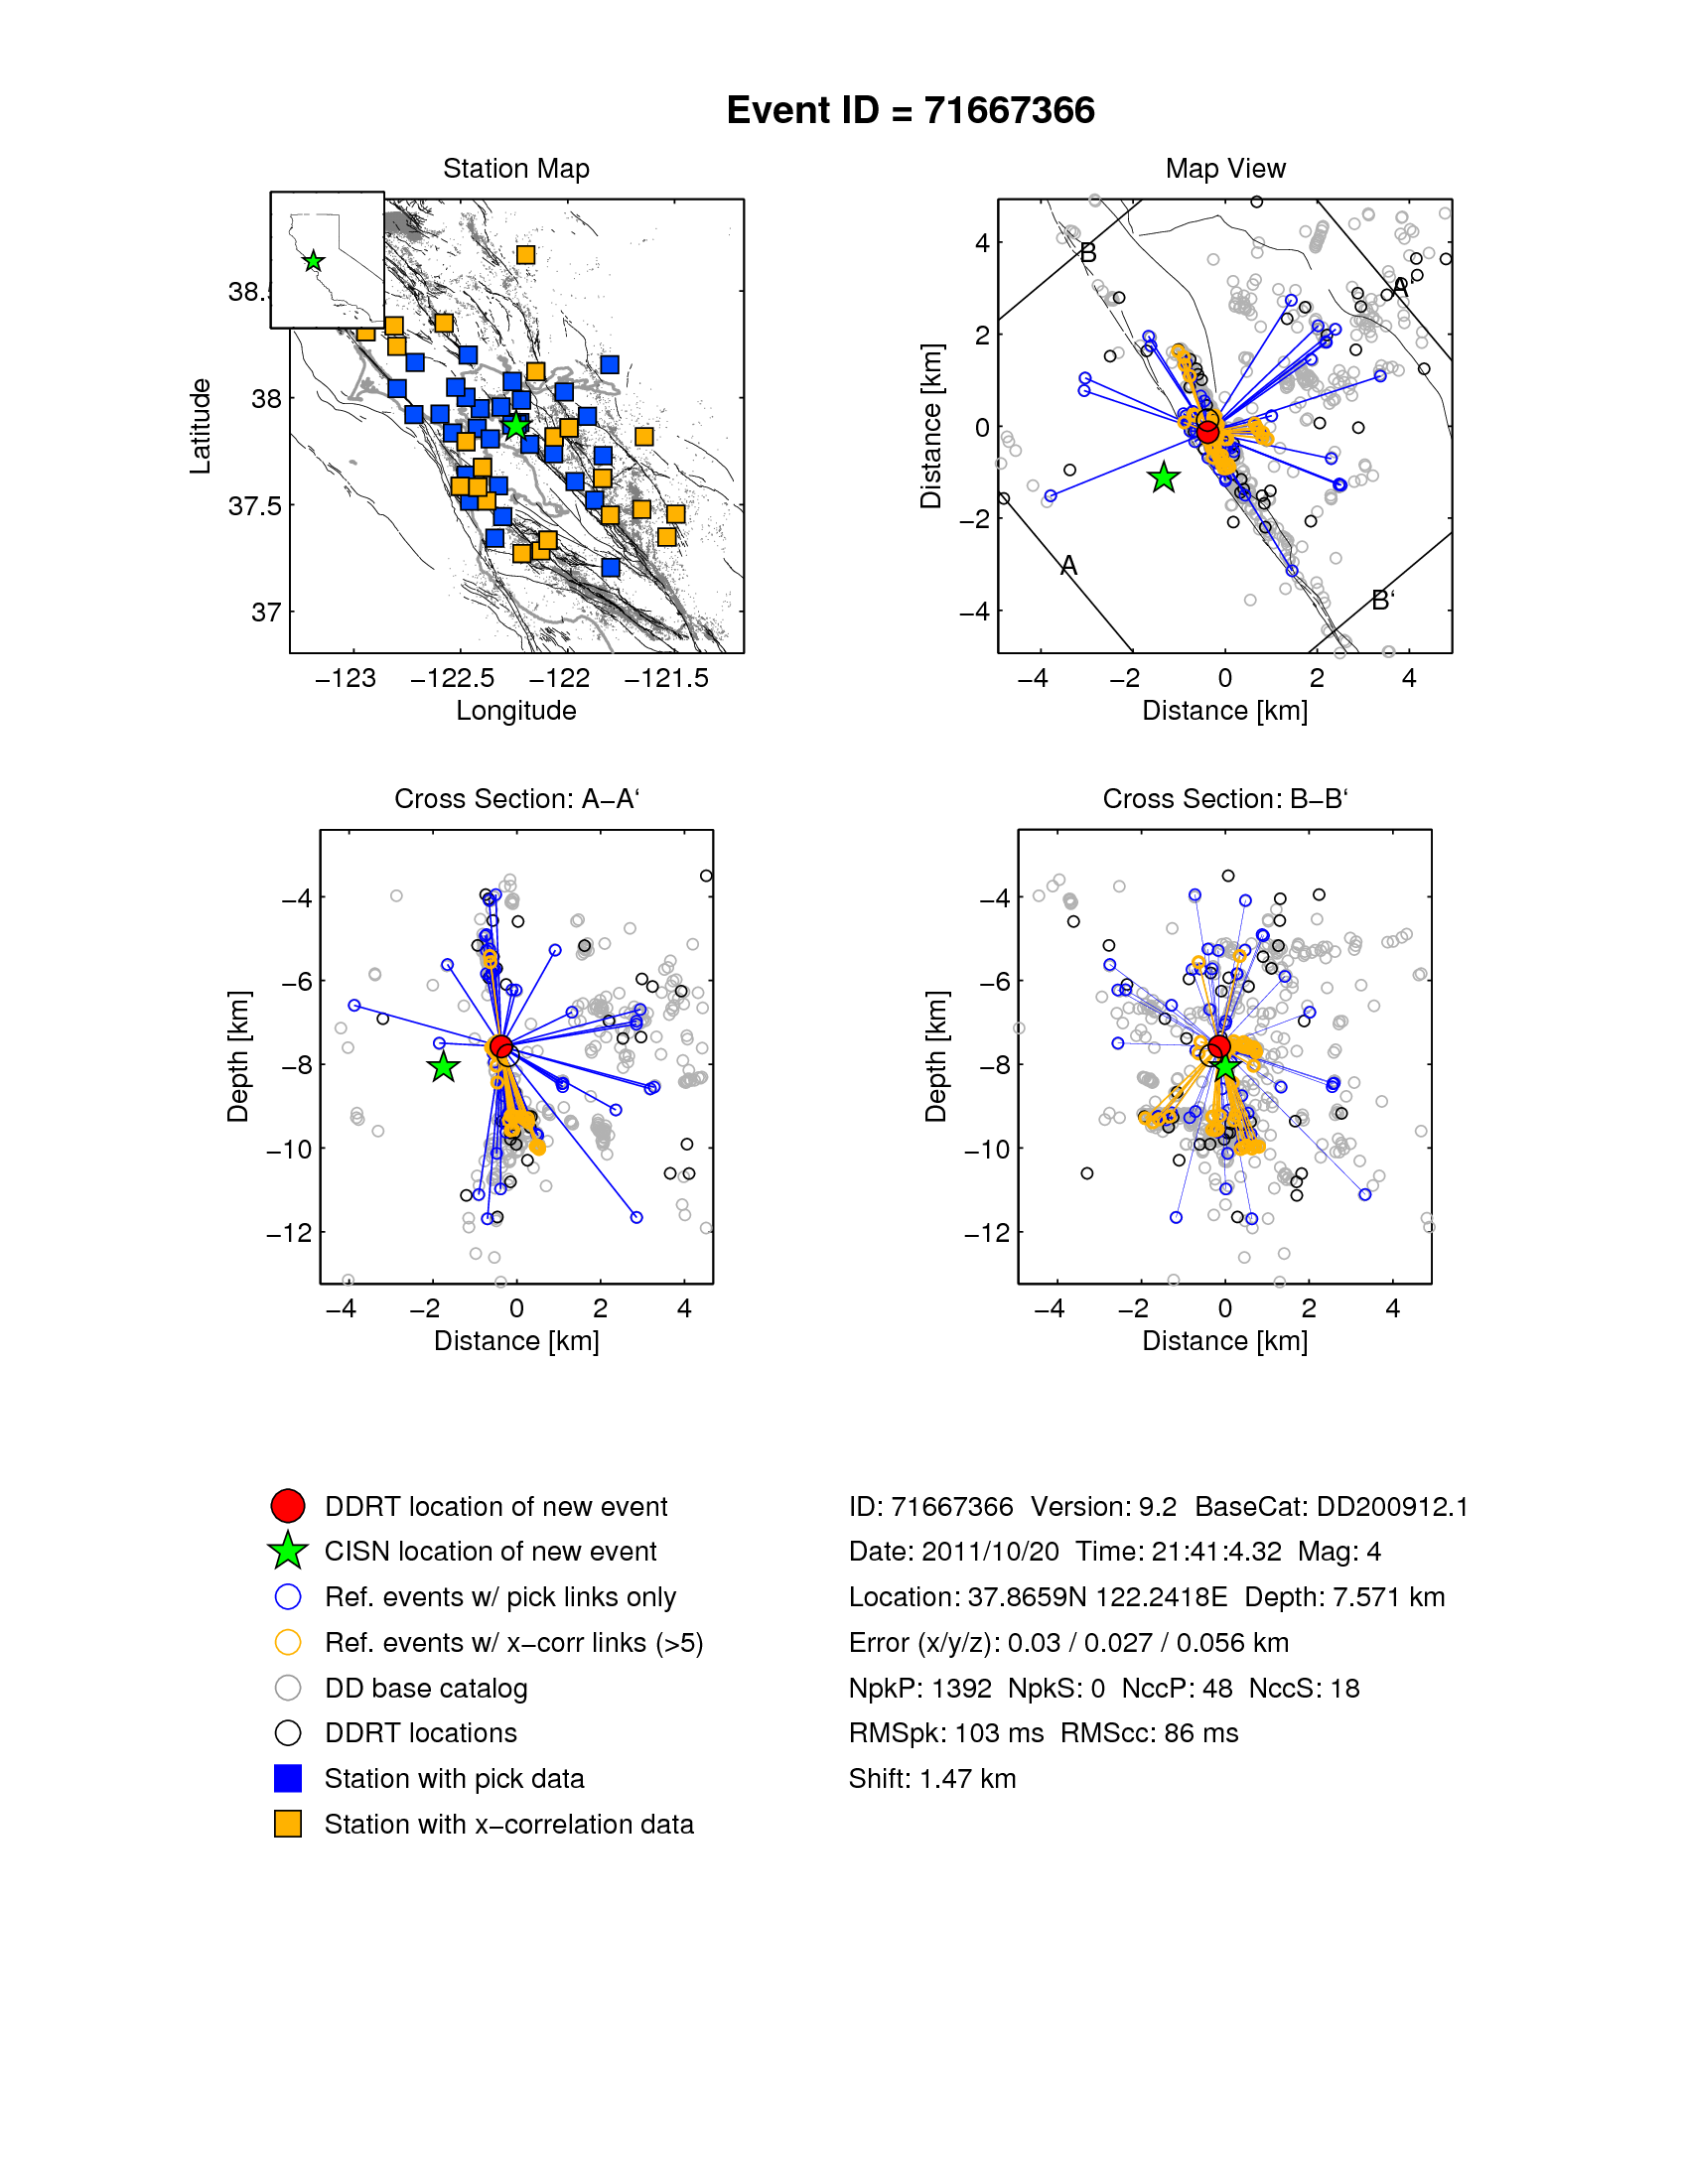
2011/10/20 M4.0: Fault overview figure. Event summary figure. 3D view.
Aftershocks:
hypoDD-RT solutions:
ddrt.dat.
Contact: Felix Waldhauser, LDEO, Columbia Univ. (felixw@ldeo.columbia.edu)
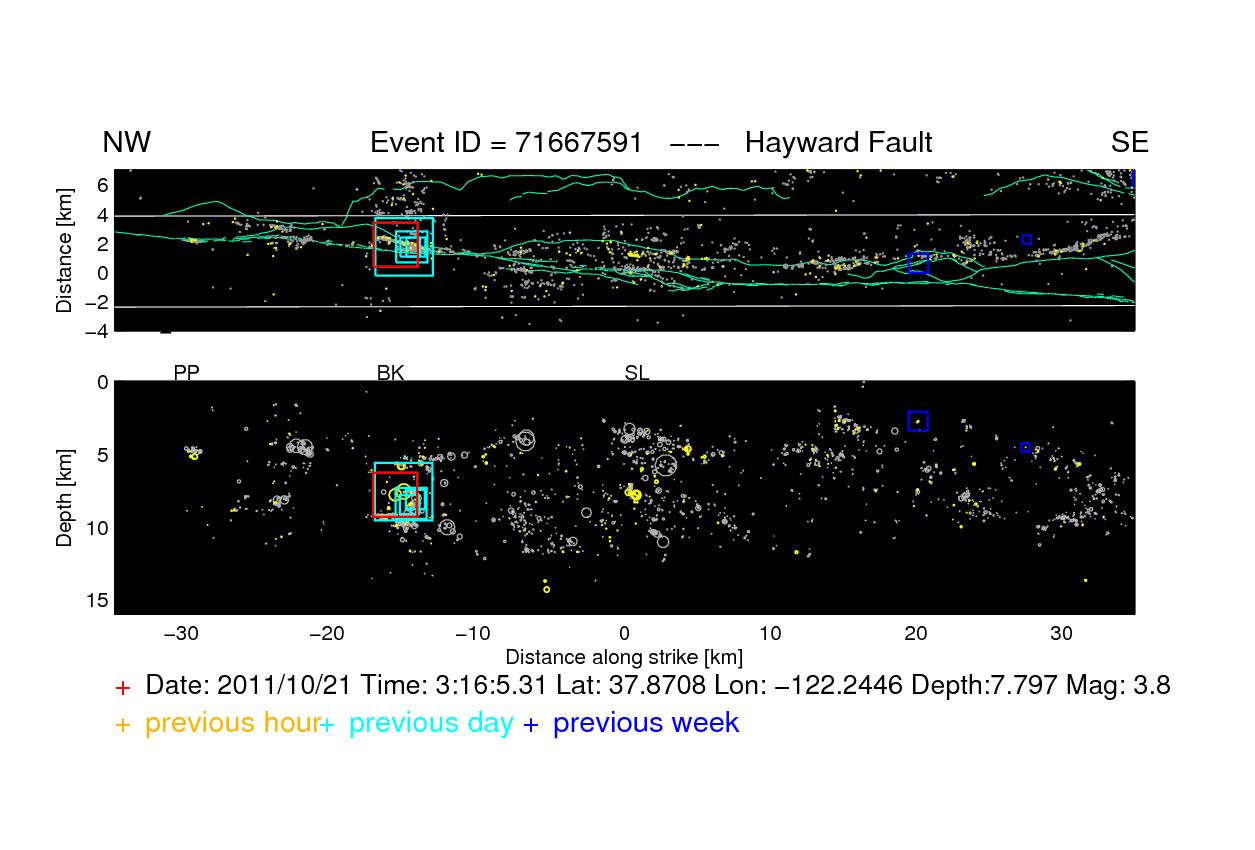
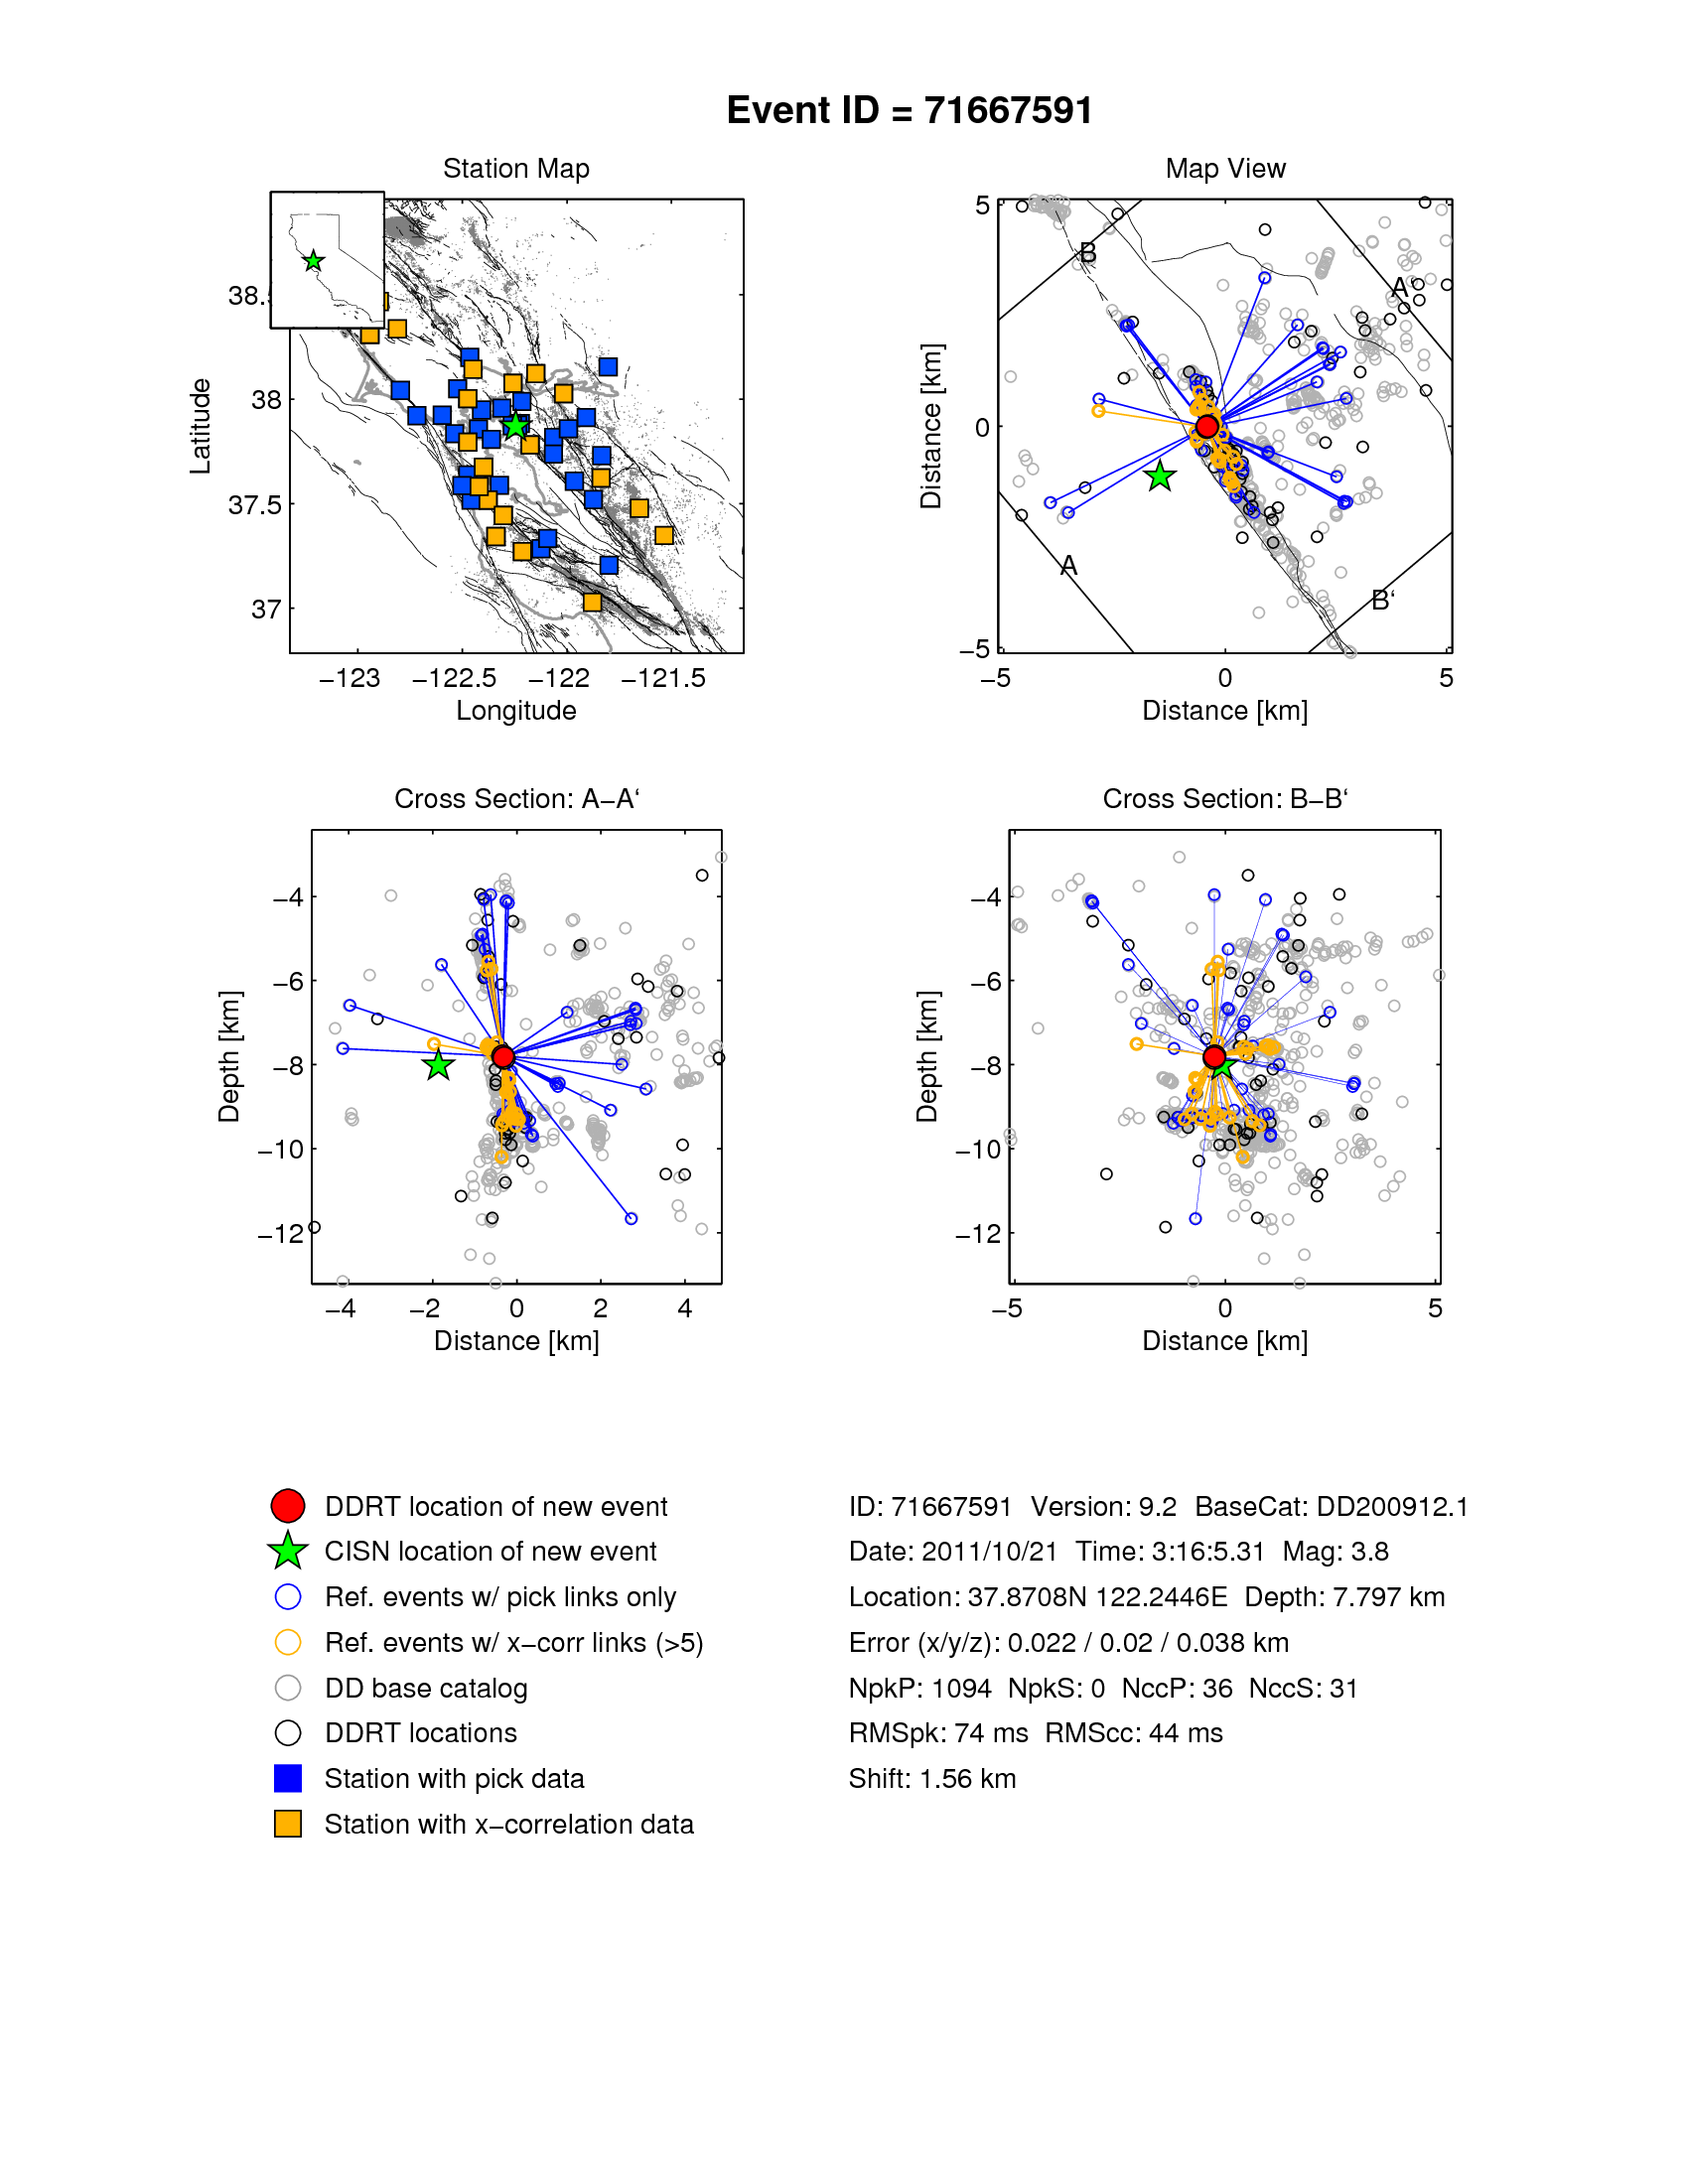
2011/10/21 M3.8:
Fault overview figure.
Event summary figure.
3D view.
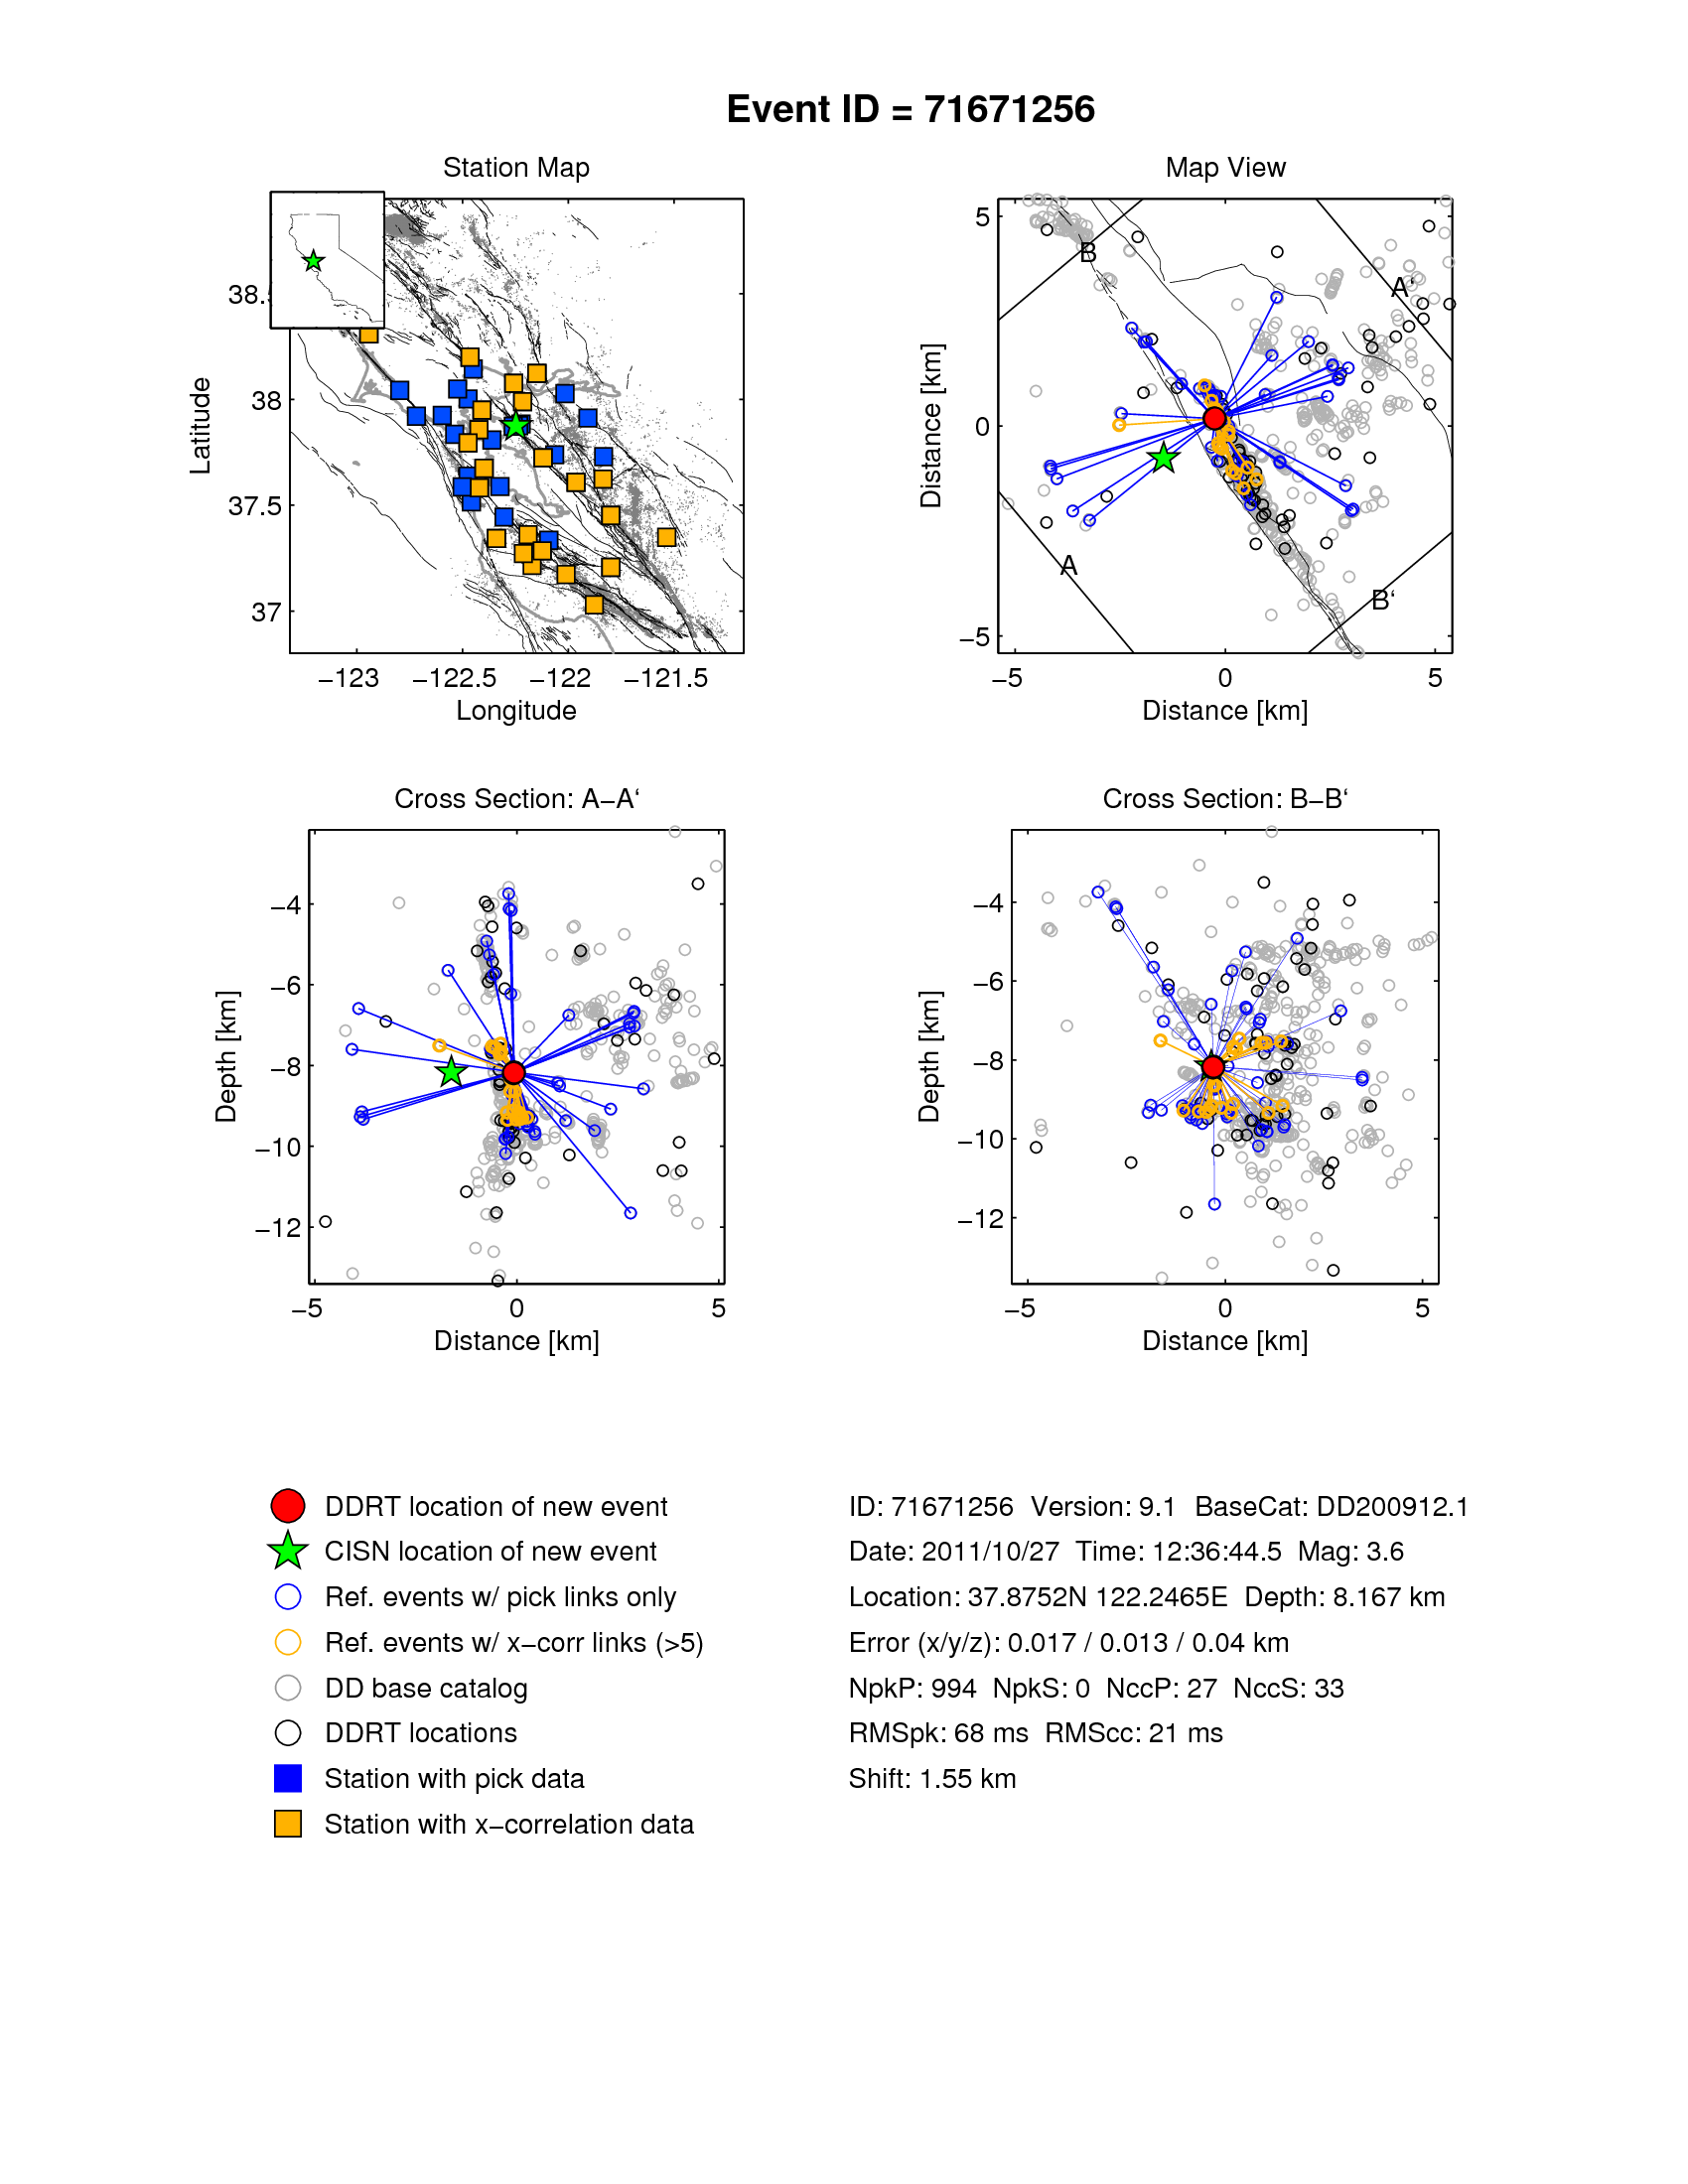
2011/10/27 M3.6:
Fault overview figure.
Event summary figure.
3D view.